Never Do The Same Thing Twice: Automate

When it comes to the work around examination and investigation, there are many tasks that are fairly simple, repetitive, and still require more than 2 seconds of your time. Production of labels, documents, preparing storage media – for years we’ve had templates for the work that’s almost pro forma, but why are we still using our own time to make the same five, ten, twenty clicks over and over again? If the task itself does not require DF or even human expertise, a human does not need to do it.

Even more important, is what I call the problem of “dead time” – time when either a person cannot work because their station is busy, or a station is waiting for human input. I don’t work 24 hours a day, so there is of course time when my computer needs me to click a button and I’m tucked up nicely in bed or 4 episodes deep into a binge. Automation can prevent cases where processing is delayed for a weekend because software needed some boxes ticked and buttons clicked.

The Current State

Case Management Systems can help with documents – it’s thankfully been a long time since I’ve had to manually complete a transport manifest (though before a CMS took over, good old Excel macros did the job amazingly well). What they can’t help with is anything outside their operating sphere, anything a practitioner does that is per their SOPs, per their organisation.

Forensic software companies, too, are gearing up and deploying their automation solutions. A lot of these will live in their own ecosystems, but some do play with others. To what degree an automation platform works for an organisation depends on existing tools and procedures, and how much 3rd-party creators open up their software to be automated.

This is not a discussion about the software that plays well with others; this is about the other software.

Automation for the Stubborn

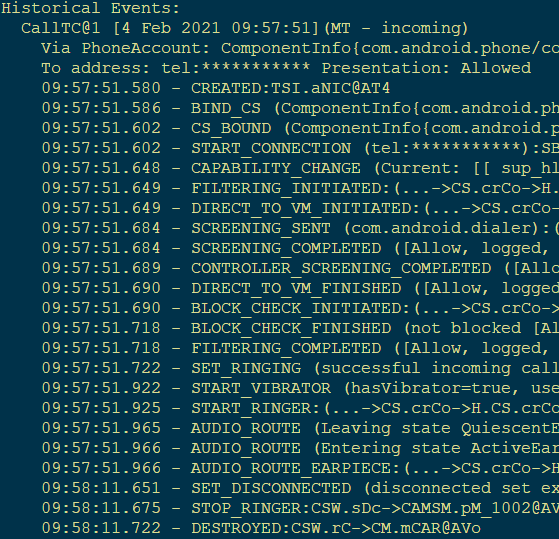
Let’s take a realistic situation as an example. I have an iPhone performing a full filesystem extraction (jailbroken/checkm8/etc.) that’s been running for about 2 hours on, let’s say, a Uniquely Favoured Extraction Doohickey for my PC. Having checked the phone, I know it has about 210GB of data on there, so it’s not going to finish in the 5 minutes before I go home. At first, that seems great – it will keep extracting while I’m not there, meaning no dead time. Except when it finishes in the late hours and sits there telling an empty office that it’s done its job.

When I come back in, I see that it’s finished – great. Now I just have to load it up in some kind of Professional Analysis software, choose any hash sets, processes, etc. that I want and wait a couple of hours for it to load up and finish processing. Reviewing the data, there are a few scripts I want to run and an export or two to make. Now everything is as it should be, I decide to report everything out. And then I wait again. This could potentially roll into day 3.

But what if it didn’t have to wait for me? Surely seeing that the extraction is complete, then making the few clicks and ticks to get it decoded can be done by machine? Yes, they can.

Removing The Human

Most programs built for Windows will use default Windows libraries – why create your own window manager, event raiser, buttons, etc. when you can use what Windows provides? And for programs built like this, WindowsUIAutomation has an in. It works for big software, and it works for little Windows Forms applications you make in VS Code. I won’t cover the documentation, but I’ll cover the basics, then how it can be implemented to do what you want.

In WUIA, everything is an Automation Element. Each element has properties, and many have callable functions (Control Patterns). You can Invoke a Button, Toggle a Toggle, and set a ValuePattern for a TextBox. Basically anything a user can do by clicking and typing, WUIA can do. But isn’t this just an old school autoclicker? No. It doesn’t use coordinates, use computer vision of screenshots, POST mouse messages, or any of that – it is part of the .NET Framework that allows this level of accesibility. It does have limitations, but workarounds are available in these fringe cases.

To automate something, you need your own program to run the WUIA aspect. The program you want to interact with becomes the root Automation Element when you create the element from the target process.

C#

AutomationElement rootElement =
            AutomationElement.FromHandle(process.MainWindowHandle);

This element behaves like every other element you will come across, but because it’s the root, there’s no Invoke or any other methods like that. This is just used to enumerate the child controls contained within/beneath it. This enumeration can be limited to child controls matching user-defined criterea, though these criterea need to be built as Conditions, which I found a little cumbersome in places. For complex conditions, I found Linq extensions to be very useful.

C#

parentElement.FindFirst(TreeScope.Subtree,
        new PropertyCondition(AutomationElement.ClassNameProperty, "Edit"))

vs

elementsCollection.OfType<AutomationElement>()
        .First(x => x.Current.ClassName == "Edit")

These are two ways to achieve the same thing, but the second allows for looking around, e.g. properties of the parent or child control. This is particularly useful when controls have generic or shared names.

Once the desired control is located and method identified, the minimal way to call its functions is like this:

C#

object pattern = null;
element.TryGetCurrentPattern(InvokePattern.Pattern, out pattern);
((InvokePattern)pattern).Invoke();

I ended up wrapping this in a function that included null checking and type matching so as not to throw errors all the time.

Now all this is great for simple situations, but unfortunately programs take a little time to do things, and controls pop in and out of existence depending on what’s going on. In addition to methods to find controls and to use the appropriate method with those controls, extra functionality is needed.

Waiting for something to appear can be achieved with a delay timer, checking every 10 seconds or however long to see if there’s a new element matching the Condition. The same can be done with waiting for something to disappear, though WUIA will throw errors of you look for something that doesn’t exist. Finding the count of elements with the matching Condition is the way to go: if count is zero, go about your business.

C#

WaitWhileElementExits(element); // custom wait function
Exceptions

Unfortunately, the implementation of some software features, by design or accident, really do not work with WUIA. It is at these time the good ol’ mouse-click simulation has to be relied upon. With WUIA, it’s not a stab in the dark, though, as the framework can provide you with a clickable point on the control and bring it in to focus, so it doesn’t click on the wrong program.

This is certainly the case in a popular Physical Analysis tool when generating reports – one type of custom control used in the software only seems to respond to system-wide mouse-click calls. How an end-user without a mouse would generate a report, I don’t know.

Making It Usable

Hard-coding instructions into a program is not a good idea, and I shouldn’t need to go in to why. That means an automation program would need to be able read a set of instructions. In theory, the automation tool should be able to work with any program, and the instructions could inform the tool which program to load or attach to, and what to do from there.

ACTION#invoke; SELECTBY#Name; VALUE#ExportOkButton;
ACTION#waitwhile; SELECTBY#ClassName; VALUE#ProgressBarWindow;
ACTION#changetarget; SELECTBY#ProcessName; VALUE#paint.exe;
ACTION#invoke; SELECTBY#Name; VALUE#CloseButton;

Helpers

Automation on the smaller scale can improve the worklife of DF practitioners too. I call these tools Helpers, because Jeeveses doesn’t roll off the tongue. These can be simple, 4-line scripts, or compiled programs.

To have a usable, searchable storage solution/archive, departments will have some mandated case files organisation or structure. Since it’s in the SOP, creation can be automated. Open your case on your management system, assign yourself to it, create the case folders. A Helper could pull the case reference number (or even case information) from the CMS and know what folders and files you need, and where they need to be. If you need to restrict access on a shared storage location, the Helper could do this too. It saves a minute, probably, but it’s a minute every time you do it, and prevents user-error.

What about the physical production of reports? Not everybody is on a cloud solution yet, and reports will need to be delivered in a usable format. Naming conventions, disk formatting, included documents/documentation – if it’s standard, it can be micro-automated. A Helper could detect when a USB storage device is attached, check its status and specifications, and, after prompting the user, format, name, encrypt, and copy files to the device. (Odd thing: I’ve noticed that the actual formatting of a disk is quicker when running a format command in C# on a ManagementObject.)

C#

volume.InvokeMethod(
        observer, 
        "Format", 
        new object[] { "NTFS", 
                       true /*quick format*/,
                       4096 /*cluser size*/, 
                       newName,
                       false /*compression*/}
        );

Paginated HTML reports (as some software still produces) can be less than ideal. Helpers can change page-based item indices to global indices (i.e. “Item 1” does not appear on each page, but is continues over the pages), resize or replace images, remove or add table columns, or format to a corporate/organisational theme.

The Dream Is True

Home-grown automation won’t replace the human aspect of DF, but it can replace the machine aspect of the job, the tasks that require no specialist skill or knowledge, just time. What could work look like for this practitioner?

They would open the case on their CMS and familiarise themselves with the circumstances and requirements. They’d open a Helper that would see the case they have open and ask if they want case folders creating for them. It pulls the exhibit references and types from the CMS and makes the folders. They open their extraction software, set the destination to their new folder, and start the extraction. Then, they point their WUIA tool at the extraction software and set their parameters. Barring any issues, they free to engage with something else.

While working on something else, or on a call, other in anyway otherwise engaged, the extraction finishes. The automation tool sees this and loads it into the analysis software. It’s been told to run 3 scripts, 2 watchlists, a hash set, and export all videos, so it follows the instructions and does this. WhatsApp content has decoded, which is the other artefact the case is looking for, so the tool pilots the analysis software to create a report. The practitioner returns and finds their videos and report.

After reviewing the data they decide no more analysis is needed and the generated report is appropriate, so they go to produce a USB. They plug a new one in, and a Helper sees an unprotected, empty drive. It asks the practitioner if it should be formatted and encrypted using the case details from the case open in the CMS. It does this and asks the practitioner if it should generate a template continuity statement.

All in all, the practitioner has done no less skilled work than normal, applied the same standards and quality, but has done less peripheral work manually, and has eliminated an amount of dead time from the process.

The Wrap-Up

Automation cannot be left to the big companies. What they are doing is fantastic, but not specific to anybody’s practices, and only within their sphere of interest – there’s so much more that we can have tools for. Let’s make them.

The code I have written is theoritcally generally applicable, but was written to target a particular software suite. The code and tools are not currently available to the general public.

Snap Seconds: Missing Video

Some apps save incoming media to a phone’s shared storage, where it pops up in the gallery, whereas other apps… do something different. Snapchat gives users the option to save videos, which it can do to its own private app area, but it also allows media to be viewed only once then deleted, or for media only to be viewable in the app. This transient media is cached on the device, but in an annoying way that means that if forensic software providers don’t keep up to speed, forensic practitioners could be given the wrong impression that media is missing from their extraction.

Let’s get specific.

A video exists on a handset – you’ve seen it, you’ve played it, and its 8 seconds of footage will aid investigation and prosecution. You look through your extraction and find the video attached to the Snap… and it plays for about 0.3 seconds. Where’s the rest of it?

A full extraction of an iPhone will recover all files generated by Snapchat. These will be in the Applications folder, deep in the file system. Good forensic software should be able to jump to the video file you want straight from the message thread, else you’ll have to navigate down /private/var/mobile/….. all the way down to the app folder, which is named for the app GUID, then into the cache content folders. Pro tip: you’re looking for a folder with “SCContent” and “_3_” in its name. The file will likely be only a few kilobytes – hardly enough for that 8 seconds of video. Forensic software will categorise files, and this file should show in the Videos category, not because of its file extension (it doesn’t have one), but because of its header.

Snapchat videos are streamed to the device and cached in segments. When a message is initially received, the first few kilobytes are saved to the device. This is the file with the MP4 header, and this is the file that plays for 0.3 seconds. When the user views the video in the app, more is streamed and cached on the device. Crucially, the subsequent segments have no header and will not be categorised as videos.

Left: an example first segment; Right: an example second segment (note the lack of header)

In the past, Facebook and Instagram have split streams into files with an .exo extension, but going further by splitting audio and video streams – thankfully this isn’t currently the case with Snapchat. These video segments are named in a helpful way too. The first video will be something like “85610365923519_0-128“, with following segments named with the same video ID and in 1kB or 2kB chunks, e.g. “85610365923519_128-1128“, “85610365923519_1128-2128“. Other initial ranges are possible, but all start at zero. It really is as simple as whacking them together (in order) – this can be done manually in a hex editor, done via the command line of any OS, done programmatically, or (with a little work) done within your favourite forensic analysis software. The stages I recommend are:

  • Identify unique media IDs
  • For each, confirm the first file header conforms to the MP4 standard
    • Order the segments, including dummies (zeros) for any gaps
    • Write combined data to a MemoryNode (or similar) in mobile forensic software
    • Amend the Snap to contain a media link to this new file
  • Output and store a list of modified/corrected data

Not all of these videos will be user-generated, but instead be ads – I’ve yet to find a way to differentiate between the two before reviewing them, though I’ve not delved deep into all of the databases. In addition, there will likely be several types of file in the same directory as these Snaps. These include:

  • Image (JPG, PNG)
  • Archive/container
  • Config data/META data

I would also make a distinction within the MP4 category – different data between the MP4 sub-type atom and the following atoms which I think is a further definition of the codec, though I not an expert on the MP4 or MPEG specification. This can be seen in the second line of the MP4 header shown above. I will note I’ve observed that some forensic software has issues playing one or more sub-types, whereas I have not observed the issue with dedicated video tools such as VLC.

I don’t think there is anything worth remarking on when it comes to the images, but the archives and other data could be interesting. The name format for the images is currently only the media ID without and additional info following an underscore or dash. Files where the ID is followed by “_z[00000000000]” (and sometimes even without the “z”) are archives which may share an ID with a video. Again, no file extension is used. I have found these files can contain a thumbnail of the video and some meta data in JSON format – these are certainly unpacked by the tool I use primarily, though it’s not evident that the data within is parsed or whether its at all relevant.

TL;DR

Forensic software may not join multi-segment videos for review or reporting. Multi-segment videos can be identified by a naming convention. They can be combined by concatenating the files. Scripts or extensions will make this task much faster and much easier.

You don’t need to record the phone screen just to get that video.

At Your Service: Timelining Android Usage with System Services

My phone runs about 200 services at any given time, and I bet yours does too, yet I have not seen these services queried as part of a forensic investigation. Is this because there’s very little worthwhile data there? Is it because it’s too difficult or time-consuming? Is it because all this information is gathered by the logical client of your favourite extraction software?

Before I answer those, there is one caveat, or speedbump, when it comes to services: most services forget or squirrel away their data on reboot, and many have length- or time-limits. This means for best results, the phone must be examined as soon after seizure as possible, and must have remained powered on. But on to the best results, and answers to those questions.

Services manage a massive amount of data, and they have to keep track of what’s going on. Thankfully, most services built in to Android answer to the dumpsys command, and they spew out a plaintext report we can dig through looking for important artefacts (and though not strictly logs, I will be referring to them as such throughout for ease). This information could possibly be gathered through a custom forensic app because services have accessible APIs – at least the one’s I checked – but that’s changing data and, frankly, using time we don’t need to spend. As I implied, running dumpsys over ADB is all we need. Once we have the data, it needs processing, and a lot of the time this processing is just formatting into something more readable. I have written a Python script which does the dumping and processing, which you can find here and build on for your own needs.

I start with a mock-up case study below, then go on to discuss individual services in more detail. Since the worth of these results rely on the timestamps, I would remind everyone to be as cautious as usual when it comes to device-recorded timestamps. My script does check current time and uptime during its operation, but can do nothing to guess clock adjustment history.

Case Study: “I Wasn’t On My Phone, Officer”

Whether or not someone was using their phone around the time of a traffic collision or other vehicle incident is a common line of enquiry, and evidence from the phone can be hazy a percentage of the time. This is when I see the most potential of interrogating Android services, rather than apps. In this hypothetical case, I was involved in a collision shortly after 20 past 5 in the evening of 09/03/21, and a 999 call was made at 17:26.

As an officer attending the scene or as part of a digital forensic investigation unit, you perform a logical client and filesystem extraction on my encrypted Android 10 handset. There is no internet history or call history from around the time, no SMS or 3rd-party app messages sent, and the recents stack doesn’t show anything like YouTube or Netflix. You could put in for telecoms data, but you have nothing to go on right now. Or do you?

Enter the services.

Normally, a logical or backup extraction doesn’t recover WhatsApp data (without APK downgrades), but here we can clearly see an interaction with the audio service where recording started then stopped 7 minutes later. That’s not edited, that’s straight out of the service dump.

[I’ll state that I’ve haven’t tested what audio messages/voice clips appear as in this log, but I would argue that when you are primarily relying on audio service logs, whether the user started a call or started a voice recording is not relevant – it is that their attention is taken by this communication.]

You could break out the “we got ‘im” banner right now, since that is evidence not only that I was on a WhatsApp call, but that I deleted the log afterwards, but you want to dig deeper…

There’s another section in the audio service log that might help – phone state.

That seems pretty conclusive. However, these entries can’t tell you which direction the call was. Did I make the call, or did someone call me? My phone is currently in silent/ vibrate only mode, and there is no log entry for the ringer playing a ringtone, so that’s inconclusive.

The vibrator service logs all generated vibrations. There’s interesting information in there about waveform and duration. A short vibration might be a notification, and often is, being logged as such by the vibrator service. Longer duration means the phone was vibrating for a while, which adds weight to the idea that someone called me. In fact, the log is split nicely into groups like “ringer”, “notification”, and “alarm”. Since the audio service logged that my phone was in “communication mode”, you can check the ringer section of the vibrator log and find that WhatsApp used the vibrator like this: 

Amplitudes0255025502550
Waveform Timings (ms)03004003004003001000

[I formatted it from a single line of text to this table for illustrative purposes. Another illustration would be “bzz, bzz, bzzzzzzz”, and I’ve never experienced that vibration dialling out, only on incoming calls.]

This heavily indicates the call was incoming – absence of this might, but not certainly, support an outgoing call.

Now for appops. The bulk of this log records recent permission usage, and organises neatly by app, then by permission. At first glance, this service isn’t that useful forensically, but the permissions coded into an app or granted by the user at install and run time are checked each time an activity calls on them, and the most recent check is logged by the appops service.

[I say check, because denials/rejections are logged too.]

There’s the audio recording permission check. Note: this is at 17:22 after a duration of 7 minutes, when the permission was last needed. Following that, the TAKE_AUDIO_FOCUS permission is timestamped to the beginning of the call.

Apparently, WhatsApp needs the ability to mute the microphone during calls (or equally possible, Android permissions are a bit clunky). Below that, both read and write access to the “external” storage (emulated /sdcard partition, the public storage area) is needed.

[I haven’t investigated why. I initially thought it was writing to the backup databases, but then subsequent messages should have made the same checks. Then I thought it was looking for a contact photo, but why would it need write access? Maybe it’s clunky permissions again.]

Finally above, the permissions to read media audio and use vibration are also checked at the beginning of the call.

The batterystats service logs all significant uses of battery by apps. What counts as significant use? Moving to the front of the screen.

The timestamps need converting from the log but you can see that the home/launcher was knocked from the top to be replaced by WhatsApp by the ±top flags.

[Batterystats is discussed later in a bit more detail]

Unfortunately, the contact name and number are just about the only things not logged.

Case Study Conclusion

Even if this data was not to be used evidentially, it could be a great aid when constructing a timeline or interview strategy. These are just a few of the services running on Android, and I would say conclusively prove that a WhatsApp voice call was received and answered on that handset, and the driver was in a call at the time of the crash. If the phone had connected to Bluetooth, that would have been logged too, perhaps being instrumental in deciding between Dangerous Driving and lesser charges.

Notes on Individual Services

As I said at the top, there are around 200 services running on (my) Android and I’m not going to cover all of them. Below are comments on a selection of useful services.

Audio

The OpenSL ES audio player default to Android appears to have a 5 seconds “cooldown”, such that instances of audio playing within 5 seconds of the end of another instance will keep the audio player alive. At the end of this 5 seconds, audio control is released and the process dies. I think this is not forensically significant, as I see little value in tracking process IDs when identifying whether audio was playing or not.

What could be very important, is that the events logged by this service do not mean that the audio was audible. If the phone volume is muted, the audio will play but cannot be heard – the speaker will not be activated and used. Phone volume may not have a detailed historic log, but the current levels are monitored by the same service as we got this data:

More may profiles exist – this is simply illustrative

Adjustments to volume by stream are logged by the same service.

Batterystats

Firstly, you should know there is a batterystats explorer[link] maintained apparently as part of Android developer tools. I found that the page was last updated in May 2016, so may not handle current Android stats. It presents a nice overview and can give per-app visualisations. Example:

https://developer.android.com/topic/performance/power/battery-historian

This appears great in isolation, but manages to have a lot of data likely extraneous to forensic purposes and only logs notable battery usage. The decoding in my script may not be as thorough as the official program, but combines batterystats with the data from other services.

In my testing, batterystats’ logging seemed to consistently reset each morning the phone was taken off charge. That reset is also indicated in the official screenshot above. But what’s actually in the log? First, I noticed a fun quirk where the timestamps are relative to the start of the log.

This doesn’t present too much difficulty though. What does, is that multiple events can be logged per line (which implies there’s a tiny buffer or queue that is read on a tick).

Another thing I’ve found is that audio control is released and reacquired periodically while in use. One line in the log may contain the –audio flag, and the following line have +audio. This reacquisition may even be within a couple of milliseconds of the release (and the user would never hear the “gap”). I’ve not delved that deep into Android source code to find out why, I’ve simply accommodated this quirk in my script: using audio, such as in a call, for half an hour logs possibly hundreds of battery usage events, so my script ignores these blips and presents the usage as a block with a single start event and single end event.

Unfortunately, batterystats does not record which package is using audio. If we have to rely only on batterystats alone, we have to do some interpretation and inspect the battery usage around the first audio event of a block.

Raw output of batterystats dump

At the time of those log entries, only Google Music was playing audio on the phone, but we can’t categorically state that from the information in the log. This log should be combined with others for verification, but it is certainly indicative of usage that the only services active (particularly +fg entries) around that first instance of +audio are from com.google.android.music. These job and sync events are background processes by the app, so may be diagnostic but not forensically significant, only telling us that an app service was active. Serious note should be taken that these can be active when there is no user interaction with the app, and these should just be seen as informative or corroborating data. The only flag that can inform us of direct user interaction is top, where an app is made visible on the screen, though things like full screen alarms will also create top entries.

One last thing – batterystats records when the power button is used to wake the device, but not when it is used to put the device to sleep (because that doesn’t use power),

Deviceidle

This is dependent on the Doze feature built in to Android 6 and onward. When the device is in idle or deep-idle mode, various services are suspended in order to save battery, so timers and events may be postponed until a periodic maintenance window (a single line of communication previously called GCM but now called FCM is kept open and managed by Android during doze so that messaging apps can still get real-time updates if coded correctly, and alarms can still be raised as frequently as every 9 minutes). These idle modes have checks and timers so they don’t activate when phone is in use. The deviceidle output includes a list of time conditions for entering these idle states.

It’s not super-easy to understand what all of these entries mean (and there are far more than pictured), and it would seem to indicate that there are many, many states for the device to be in. During testing, I observed only 5 conditions logged.

From my examination of the logged entries, light_idle_to appears to be how long the device has to be left alone before it enters “light idle” mode. If this entry appears after “normal” mode, it indicates the device has not been used for (for this phone) 5 minutes. But “not in use” and “normal” need understanding too. If there are no restrictions on power or processes, this is “normal”. Charging a device allows the phone not to restrict power usage to preserve the battery – it’s charging – so a charging device will show as “normal” and not “deep-idle” in this log.

The “deep idle” mode appears to be set by the simple idle_to flag, which is set to 1 hour on my phone. But “deep idle” mode is not activated 1 hour after “light idle” mode is activated – other checks need to be made. A project I found for editing timing explains it best,but it effectively cascades down a checklist with specific timers. You can say that a device has not been used for at least 1 hour (or as listed in the dump) if it entered “deep idle” mode.

Sensor

I have included this one on the off-chance it captures massive accelerations. However, raising the phone up from a table to look at it, for example, will register with the service, likely wiping more historic data. This could be fantastic data for collision investigations, if it manages to actually capture the collision event.

In terms of interpreting sensors, the accelerometer is probably the most viable in providing this data. It records linear accelerations in the classic x, y, and z planes, and it records it in the standard meters per second per second. A stationary accelerometer on a flat surface should register 0ms-2 in 2 planes, and 9.81ms-2 in the remaining plane, usually the z plane. A negative deviation from 9.81 in the z axis implies acceleration in the same direction, i.e. the phone is moving downwards, and a positive deviation means acceleration away from the gravity source.

Powercontrol

Similar to deviceidle, this tracks inactivity. It has more historic data, but only seems to record events such as overnight when a phone is charging. It lists these as “idle” events, but seems to have a different definition to those in deviceidle. In examining this log for my own phone, it is quite obvious what my shift pattern has been for the past 2 months.

Telecom

I think this is fairly self-explanatory – it logs calls in high detail. Sadly, phone numbers are blocked out.

Usagestats

Very useful for recent, second-by-second user activity, like with batterystats. This, however, records which activity was launched and not just just the calling app. To use WhatsApp as an example again, we can tell if a user opened the contacts, settings, or conversation views.

[...] package=com.whatsapp class=com.whatsapp.Conversation

Some difficulty arises if we assume “Last Time Seen” refers to the device user using an app. I encountered several instances where this did not reflect real activity. Slightly changing the scope from “seen” to “used” produces more accurate results, so this is what I’ve gone with in my script.

Also, there seems to a bit of bounce when switching between activities, in that the new activity may be triggered before the previous activity has completed its pause/stop task. This can’t really be coded for without adding more invisible interpretation to the data – I think it best to leave it minimally processed, timestamped as-is, and remember this bounce when examining this log.

Quick Fire Round

This is not an exhaustive list of services, and different vendors might have their own services too, but these are a few that at first glance appear forensically useful but actually mostly aren’t.

  • Alarm – internal job chronometer, not the kind that wakes you up in the morning
  • Connectivity – tethering.
  • Content – app syncs to Google account.
  • Display – framerate, brightness, and other display properties.
  • Dropbox (if installed) – lots of automatic keymaster events. No mention of Zuul.
  • Fingerprint – single line JSON with number of fingerprint uses since boot maybe.
  • Input – detailed touchscreen information.
  • Input_method – lists a few screen touch events (no locations) but likely overwritten by the time Developer Options are enabled during examination.
  • Location – mostly satellite information.
  • Mount – what you’d expect; the emulated sdcard partition and any real SD cards.
  • Netpolicy –may be useful in fringe cases, it keeps a very short log of firewall checks.
  • Netstats – no timestamps or app details.
  • Network_stack – validation and possibly video casting logs, no app info.
  • Secrecy – pretty much just phone IMEI, and no activity relevant to this work.
  • Shortcut – no activity, but interesting that it has apps’ popup menus, and (for communication apps) can give you contact names/numbers if they’re a pinned or frequent contact.
  • Storaged – app and process sizes in storage and memory, no logs.
  • Trust – logs agents such as location-based and connected-MAC unlocking.
  • Wifiscanner – very useful when looking for WiFi networks seen on last scan (my phone logged 34 networks with SSID, BBSID, security, and signal strength), but not useful for this work.

Closing Remarks

Hopefully if you’ve made it this far, you see the benefits of grabbing this data and analysing it as soon as possible after time-sensitive incidents. My example focused on a traffic collision, but could be equally useful in piecing together the activity of a vulnerable person currently Missing From Home. The script I’ve written is effectively a collection of parsers as one monolithic script. Coming in at 450 lines, I’d possibly call it a megalith of a script. Currently, it outputs the parsed data to a text file, which can be loaded into other software and parsed – I made a decision not to output all dumps to their own file, but this is easily amendable for your own need. Since my script produces a list with a datetime object in it before writing to file, you could take a copy of my code and wrap it in a function to be called by whatever other tools or scripts you are running. For example, it should be fairly simple to use this in conjunction with Cellebrite’s Physical Analyzer and add all of these newly captured events into an existing timeline.

If you want to use my script but don’t want to scroll all the way back up, here’s the link again. If you want to start exploring services yourself, you can start by running “adb shell service list” to get all running services on a device, then “adb shell dumpsys [service]” to get the output. If you have any comments, I’ve left comments open below, or I can be contacted on LinkedIn.

References & Reading

Perceptual Hashing: A Shallow-ish Dive

Cryptographic hashing is fundamental to Digital Forensics, we can all agree that – unique identifiers that can be used to locate exact duplicates of a file, without even needing to have the original file. No digital unit in a UK law enforcement agency can run without using CAID. The NSRL, contributed to by NIST and US federal agencies, is an important tool for filtering out known good files.

But there’s a problem with using cryptographic functions to identify image and video content, and we all know what that is. The content of an image is perceptual – tech companies are spending billions on AI, or having us train them what a lamppost or a traffic light looks like. Short of a shared AI engine, what can we do to identify thumbnails of an image, or an image that has been re-encoded? 

Perceptual hashing. 

This isn’t a new thing, but the UK doesn’t yet operate a national CAID-like system based on this. Why might we want to, and what might be stopping us?

What is Perceptual Hashing? 

In the shortest terms, is it an algorithm that can be used to produce a consistent output given images that would result in different cryptographic hash values but that would be considered the same (or substantially similar) by a human interpreter. 

Take a picture, mirror it, turn it black and white, resize it, remove the blemishes – to humans, the result is still recognisable the same picture (or at least, the same source). We see the colours and the pixels and the shapes, where the computer sees only the hex.

Several perceptual hashing methods exist, and I’ve explored a few of my own thoughts as well. Most of my methods trended towards a grid-based/block-based model, where the source image is broken down to an NxN grid, with functions being performed on each grid square and the results being combined into a single hash value. I looked at histograms, variance, and a few statistical functions. However, I believe that Average Hash (or ahash) generally produces better results than I could achieve – in most cases.

Types of Perceptual Hashing There is a Python library currently maintained call ImageHash, which groups together methods of perceptual hashing. I’ll be referencing this for convenience, but this shouldn’t be taken as preaching the gospel.  Each method starts with scaling the image down to a square grid, and converting to greyscale. A summary of methods is below.

  • ahash: take an average pixel value of the whole of the new image and assign a 0 or 1 to each grid square based on whether it is above or below that average.
  • phash: perform a discrete cosine transform and then use the lowest frequencies as a basis for an ahash-like process.
  • whash: the same as phash, but using wavelet decompose instead of a DCT (interesting read).
  • dhash: based on the gradient between proximate pixels.

According to authors of the Python library, ahash performs the worst when searching for similar, not identical, images. Nevertheless, I chose ahash as a basis for a bit of work/play.

How to Perceptually Hash

I would call the first stage of this process “image preparation”. There are too many image formats, and each has their own standards and quirks. The ideal starting point for ahash is a three-channel-per-pixel map of the content, but that’s not how most formats work, so the image must be converted into a matrix, with colour values from 0 to 255 per channel. Alpha channels can be discarded or otherwise handled (provided that method id consistent).

The range should then be stretched so that all values from 0 to 255 are used. Why? This could be an arbitrary step in my implementation, though it should be noted that one thumbnail I created was a perfect match only after stretching the contrast. If used, the interpolation method must be set across all organisations using the same hash sets, or the accuracy of results would suffer – discarding or rounding values at this stage may produce significant variations later in the process.

Three different desaturation methods (original image: andessa)
Image split into RGB components

At first, I used PIL’s function out of simplicity, but then later explored weighted channel mixing. There was a minor difference in which images appeared as false positives, but nothing I found to be significant in the highly similar (>90%) rated images. A test image where I had shifted the hue ±180° was computed as 96.9% similar to the original hash, illustrating that an ahash value is still fairly colour-agnostic.

That’s one reason to convert to grayscale – colour adjustment of duplicates can be mostly ignored. If you kept the data from 3 colour channels, you’d have to do some clever thinking to identify an image with the hue shifted, for example, 40°. Additionally, the hash would be longer by the multiple of the number of channels; in practice, 192 bits rather than 64 bits for 3-channel images (see next section for why 64 bits). I suggest a possible compromise at the end.

I would recommend to the digital forensic community that if perceptual hashing is implemented on a large scale that the conversion method is mathematically defined rather than relying on a specific library or tool. This means cross-language and cross-platform consistency.

The image now needs to be scaled to the chosen size. The size itself is something that bears discussion:  I found with my own methods that when comparing the accuracy over grid sizes N=3 to N=10 a grid of N=5 produced the highest contrast between true positives and true negatives, but also computed some similar images as less similar than other N values. I haven’t done sufficient analysis on grid size’s effect on ahash and related functions, but I have noted something about resizing algorithms when I wrote my own ahash function in Python and again in C#. I used the PIL library (Pillow fork) in Python and the inbuilt Image library in C# and my hash values for the same image came out different from each function.

Looking into this, I found that the default methods for resizing were not the same. So naturally, I fixed my code with a simple change of forcing each implementation to use bilinear interpolation. Different hash values again… I’ll admit I could have written their core functions differently, but I concluded after a lot of head-table interaction that the implementation of the interpolation in each library was different. Again, I believe a mathematical definition should be used to standardise the method, though I have not tested, for example, centre-weighted average of pixel values versus weighted brightness, or modal value versus mean value. All of my testing from this point was using PIL’s bilinear resizing, as it seemed to give the most accurate results (subjective).

Most of my testing was conducted on an N=8 grid (which is the same is the ImageHash library), meaning a 64-bit binary string, or a 16-character hex string.

How to Compare Hashes

Yes, this is issue in itself. The simplest method is the same as with cryptographic functions: is hash A identical to hash B? With this, it should be possible to identify identical images within a dataset. Thumbnails aren’t necessarily as easy as that, though, as they likely add another layer of compression and artefacts to the original image. Identifying edited/manipulated images would be impossible.

A perceptual hash is something you compare against, yes, but it is also a map – and I’ll go so far to say a magical map. To illustrate this, I took a test image and overlaid the centre third with the word “FORENSICS” in bold Impact font.

A straight comparison and this would immediately fail – 0% match, just as bad as a cryptographic hash. A comparison of each positional character though, and calculating a “similarity” rating, produces results with more leeway. The edited image ahash now shows 9/16 (56%) similarity.

Original:                0x00003e3e1e1e1e0e
Edit:                    0x00001c7e7f1e0e06

Decomposing the hex string back to the original binary show this:

Original:  0000000000000000001111100011111000011110000111100001111000001110
Edited:    0000000000000000000111000111111001111111000111100000111000000110

This gives a similarity of 56/64, or 87.5%, which is a lot better. But introducing margins like this increases the probability of false positives, right?

Comparing this to a set of 8,089 pictures sourced from a dataset website, the highest similarity to the original came out at 90% similar, and only 3 images were categorised being as similar as or more similar than the “forensics edit”. That’s 0.04% (four one-hundredths of a percent) – I have tested other images with the same technique and this is at the better end; the poorer performing instances identifying up to ~1.5% of the dataset.

What I’ve done to this image introduces more “encoding artefacts” than simply thumbnailing it, and is similar to what some social media apps do. And comparing thumbnails to the originals would be boring – all of the 10 images I thumbnailed were computed at >98% similar.

So perceptual hashes don’t produce a binary result, a yes or a no (at least in my implementation). That’s kind a long walk back to the name of the method – perceptual. Were digital practitioners or organisations to use a perceptual hash library, they would also have to set acceptable and unacceptable similarity ratings for dataset results. This could vary on a case by case basis, or the time investment/risk could be managed at a departmental (or higher) level. Based on my small 8k image dataset, if I were creating a review tool, I would set the global lower limit of similarity at around 85% and a “good match” level at around 98%.

Autobots, Roll Out

It all falls down when you transform an image. The lowest similarity between the source ahash and target ahash I encountered after rotation was 50%, using the above decomposition comparison. That’s worse than many false positives.

However, we see the magic of this map when the hash is partially decomposed to pairs (e.g. 0xC3) or fully decomposed into binary (e.g. 011010…). Since the hash is computed from a square grid of known size, we can perform matrix transformations, or perhaps more easily, slices on the binary string.

Slicing can be used to determine the perceptual hash of a mirrored image by reversing each “row” (for horizontal) or “column” (for vertical) of data.

With minimal processing power (because of the size of the hash), the hash of all transformed images can be computed, including mirrored and rotated (in increments of quarter turns). Simple transformations of stretching or compressing in the x or y directions require no matrix manipulation, but skewing might be approachable by shifting the sequence a bit or two – this is fairly uncommon though.

Depending on which resources are more readily available, either a database could contain all transformation permutation hash values, or the checking algorithm performs these matrix permutations on each image it processes (regardless, image review software would have to store and index all values for the images being reviewed).

When I had coded this “matrix permutator”, I tested it on a set of rotated and transformed versions of an original image, and found it had a 100% match rate to the original image. I should state at this point, I mean in image editing software that re-encodes the image on saving. Including transformations in the matching model will (almost certainly) increase the number of false positives in a dataset by a factor equivalent to the number of permutations.

Similar Images

In this context, I mean non-identical images with extremely high content correlation, as below. This similarity is… similar to the above, but I categorise it differently, as the above set features modified images, and this set features unique images.

Copyright Rory Lewis

While we as humans know this is not the same image, we can see the composition and content is beyond similar. My implementation of ahash knows this too – 86% similarity. In the interest of full disclosure though, 11 images from the dataset were computed at ≥86%, including the below.

Again, this is a best case scenario. Heavily manipulated images, or images in a set (such as a photographic series), were not consistently identified by this implementation of ahash – that is, a large quantity of different images were rated as more similar than two from the same set. I would argue that ahash is not well suited to this kind of identifying similarity, but can be used to aid in human-lead identification.

Additional Considerations

Centre Cropping

Mobile phone galleries like to use square cropping to show thumbnail previews of images – hash values produce from the full aspect ratio image could differ significantly from square-cropped images.

I tested one instance each of a ~30% and ~15% crop, which computed to a 66% and a 58% similarity respectively. At this time, I can think of no better solution than centre-cropping the image and storing the ahash value alongside that of the full image.

Colour Matching

The conversion to greyscale is discussed above, but the information discarded at this step may be useful. I have found one method which when used as a supplement to ahash increases result accuracy (for non-colour-shifted images) while using fewer bits than a full colour ahash. This method is almost identical in implementation, but bases the 1 or 0 value on whether the red channel has a higher value than the green channel.

I haven’t fully explored combining this with the main ahash result, but it is clear that using only this metric is not at all suitable. A somewhat convoluted implementation of this metric was able to reduce false positives compared to ahash alone, while still capturing true positives. It does however, and somewhat obviously, fail to identify hue-shifted images.

If the ahash similarity is limited to a minimum 85% for a match and this new metric is limited to >98%, the number of false positives have been reduced by up to 70% in my testing. For the image of Natalie Dormer, false positives were reduced from 10 to 4, while still identifying the second Dormer image and thumbnails.

Grid Size

You might imagine that increasing the grid size geometrically increases processing time. This was not the case when I increased grid size from N=8 to N=16 – processing time only increased by a measly 6%, so the bottleneck in my case was the image loading and processing (“preparation”), not the hash computation.

Some images computed as more similar, some as less similar. In this particular dataset, one image was above 85% similar to the Dormer image compared to the 10 when N=8. This is not proof that higher N values are more accurate – more work would have to be done in this area to find optimal grid size.

Dataset

I found my dataset online, and this is not necessarily representative of the images recovered as part of a digital investigation. The thresholds I have mentioned above are in relation to this dataset, and deciding limits for the real world should be informed by real world data.

For reference, here are two plots showing image similarity in the dataset to a chosen image.

There are both trending towards a normal distribution, but even the difference between the two suggests the dataset is not truly random. Something to consider about this dataset as well, is that it is a collection of photographs – what people thought it was important to capture and preserve, then uploaded to the internet. Real world datasets will contain images from web caches, adverts, and other non-photographs too.

Final Word

Well, that’s a quick look into perceptual hashing. Can it be used to identify visually identical images? Absolutely. Can it be used effectively in digital forensics? There are pitfalls for each perceptual hash method, and a lot of things to consider when setting up your version of it. Using ahash is simple enough that any department or organisation should be able to implement a system without going to an outside company or service and being charged for smart image matching software. Perceptual hashing is fixed, so probably can’t stand up to well-trained AI, but there is a place for it – it’s simple, consistent, and doesn’t require special or expensive hardware.

A database can be set up, much like CAID, that holds the ahash values of images we want to identify. Decomposing stored hashes is no strain on processors, so comparing a new set of images to this database should be just as fast as comparing MD5 values. Computation time to obtain the perceptual hash value may be marginally more, but provides more information. You can get false positives, just like in keyword searches, but reviewing results manually should be very quick – the human brain is good at that sort of thing.

Perceptual hashing could aid in review of material, depending on the area of interest, and is simple enough that it could be used in a volume-based approach, where, for example, investigating officers are reviewing data extractions rather than a digital investigation unit.

I can’t tell you if you should implement perceptual hashing, or exactly how to do so to best suit your needs – you need to implement what you perceive to be the best option.

Further Reading